- About
- Admin. Boundaries
- Base Maps
- Cadastral
- Digital Elevation Models
- Digital Imagery
- Environment
- Forest Inventory
- Geographical Names
- Geology Mapping
- Hydrography
- Land Use/Cover Maps
- Municipal Maps
- Quarter Section Grids
- Soil Classification
- Spatial Referencing
- Topographic Maps
- Town & Village Plans
- Transportation
- Comments
Related Sites
Canada Map Sales

To view PDF files, you must have a copy of the Adobe Acrobat Reader which is available as a free download:
![]()
Manitoba Land Initiative
Core Maps - Data Warehouse
Digital Elevation Models - DEMs
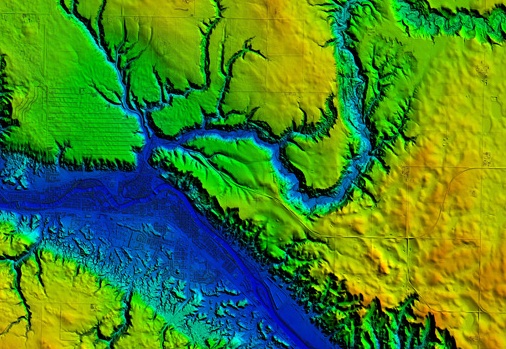
NOTE 1:Digital elevation models (DEM's) are a collection of three dimensional coordinates representing an X and Y horizontal location on the ground along with its associated elevation. These coordinate "triplets" are stored in a simple text ASCII file or Arc/Info grid format which the user imports into a geographic information system (GIS) to produce a triangulated irregular network "TIN" file which depicts a three dimensional model of the earth surface at various viewing angles as chosen by the user. DEM data are collected at various horizontal intervals and vertical accuracies depending on the mapping or GPS collection technique.
NOTE 2: Within the Red River Valley, several types of DEM data were produced to help manage flooding such as in 1950 and 1997. Products include 1999 airborne laser elevations (LIDAR), 1950 high density field survey elevations, and 2000/01 high density GPS data of all the road and railway surfaces. Detailed GPS locations and elevations were also collected in 2000/01 of several thousand raised pads and flood protection dykes. These detailed DEM data sets have been assembled into separate files so the user may combine certain layers as required. A comparison assessment of the DEM layers within the valley was completed and may be viewed in a downloadable Power Point Presentation. A coarser resolution DEM (one meter vertical accuracy) was also produced from 1:20,000 scale topographic data. These will be available in an archive at a later date.
| Detailed Red River Valley DEM Data | Overview |
Metadata |
Download |
Download |
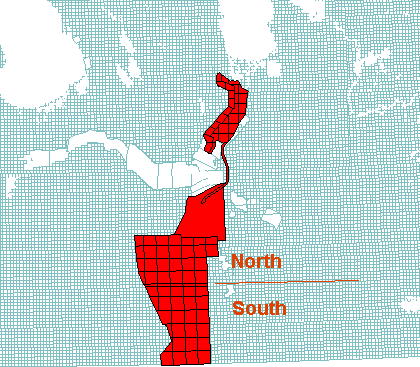
| Red River LiDAR (North Section) - very large | ASCII | |||
| Red River LiDAR (South Section) - very large | ASCII | |||
| Red River LiDAR Contours |
NOTE 3 : The break-line data sets are a series of high density horizontal and vertical coordinates collected as part of the process in producing digital ortho photos . Break line data points are typically collected on a high density grid with many more additional points being collected at river or stream crossings or at other vertical anomalies. This large array of data points are required in the mapping process to produce a "level surface" ortho photo free of horizontal displacement and distortions due to elevation changes from one part of the image to another. Another coarser resolution series of DEM files are provided from the digital ortho photos with horizontal and vertical points acquired at 100 meter spacing. These DEM's are much smaller in file size due to the lower number of data points and will thus yield a less accurate vertical elevation surface.
| Southern Manitoba General DEM Data |
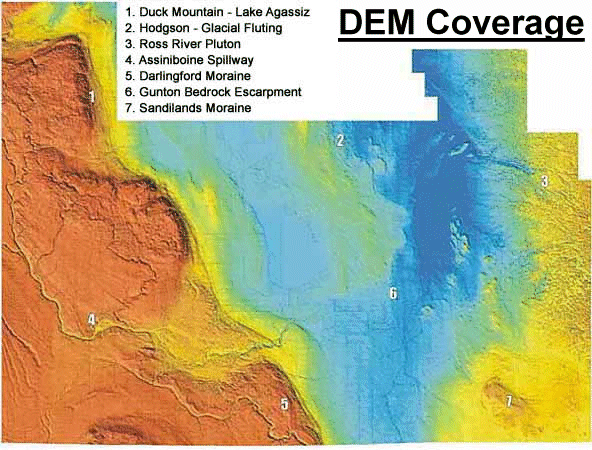
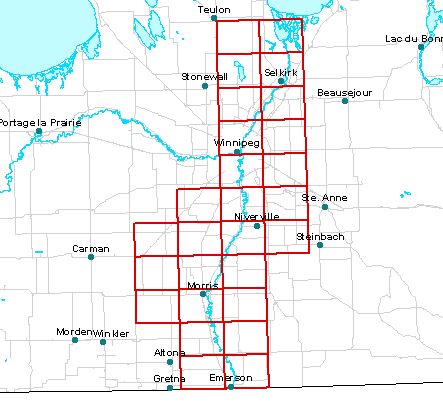
Coverage Overview |
Metadata |
Download |
| DEM break line points (ASCII format by project area) | |||
| DEM coarse resolution on 100 meter grid (ASCII text grid file of southern Manitoba) |
|
|
|
| DEM coarse resolution on 100 meter grid (Grid file of southern Manitoba in MapInfo format) |
|
|
|
| Southern Manitoba Ortho Refresh DEM Data |
|
|
|
| DEM - Years one(1) and two(2) |
|
|
|
| DEM - Years three(3) and four(4) |
|
|
|
| DEM - Year five(5) - block 130 |
|
|
|
| DEM - Year five(5) - block 140 |
|
|
|
| DEM - Year five(5) - block 150 |
|
|
|
| DEM - Year five(5) - block 160 |
|
|
|
| DEM - Year five(5) - block 170 |
|
|
|
| DEM - Year five(5) - block 180 |
|
|
|
| DEM - Complete refresh |
|
|